

In my previous Newsletter, "Data Science Evidence," I encourage data science teams to be skeptical of any claims or evidence that supports those claims, and I provide several techniques for challenging claims and evidence.
In this week's Newsletter, I'm going to dive deep into the world of missing data. We'll explore how missing data types can impact conclusions. We'll also discuss advanced techniques. These include imputation and sensitivity analysis.
We'll also cover common pitfalls. These include poor statistical models, wrong data entry, and systematic deletion errors.
Missing data can be just as misleading as wrong data, if not more so. One of the big problems with missing data is that people can't see what's not there. When you have data, you can check for errors and validate it, ensuring that any missing due data is accurately replaced to maintain statistical integrity. With missing data, you have nothing to check. You may not even think to ask about it or look for it.
By understanding these issues, you can analyze data in a better way and avoid the trap of misleading results.
Understanding Missing Data: Definition and Types

When you're dealing with missing data in your study, it's important to know that there are three main types. Missing Completely at Random (MCAR), Missing at Random (MAR), and Missing Not at Random (MNAR).
Let's break these down. MCAR happens when the missingness has nothing to do with the information we have or don't have. It's like missing pieces in a puzzle purely by chance.
In the case of MAR, the missing pieces are related to the pieces we already have. Imagine you can predict the missing puzzle pieces based on the ones you can see.
On the other hand, MNAR occurs when the missing pieces depend on things we can't see. It's like having a puzzle with missing pieces because they were hidden on purpose.
Identifying if the missing data point in your research is MCAR, MAR, or MNAR is key. It guides you in choosing the right method to manage these gaps. Each type affects your study's outcomes differently, especially when considering the value for each missing data point.
Missing Completely at Random (MCAR)
Data goes missing for unrelated reasons. They don't connect to any other information in your study, either what you observe or what you don't. This is called Missing Completely at Random (MCAR). This missing data is good in one way. It doesn't bias your results due to present or absent data.
Here's a quick look at what this means for your analysis:
Feature
- Data Independence
- Not Linked to Other Traits
- Fewer Data Points
Impact on Analysis
- Less bias in results
- Easier to fill in the gaps
- Might weaken your findings
Missing at Random (MAR)
When dealing with Missing at Random (MAR), it's important not to ignore how the data is missing. You see, we can fill in these gaps using techniques like imputation. We do it based on the information we have.
Let's talk about something called propensity analysis with missing data. This method helps us find the chances of missing data. It's based on what we already know. It's like detective work where you use clues to solve a mystery, often using various methods to fill in the gaps with imputed data.
Now, there's also something called covariate adjustment. This technique adjusts our analysis, introducing a more systematic methodology for managing data. It considers factors that might influence why some data is missing. It's a bit like tweaking a recipe slightly because you know your oven heats unevenly. By doing this, we make sure our analysis is fair and balanced, giving us results we can trust even with some data missing.
Each method, including listwise deletion, ensures our final conclusions are solid and reliable.
Missing Not at Random (MNAR)
Missing Not at Random (MNAR) greatly complicates data analysis. This is because missing data depends on unobserved information.
This situation can create serious challenges. It makes filling in these missing values, called imputation, hard. It can lead and might distort your study's findings, particularly if the missing value is replaced incorrectly.
To fix MNAR, we can use specific statistics techniques.
One key approach is to conduct a sensitivity analysis. This method helps you see how changes in your assumptions about the missing data can affect your study's outcomes. It's like testing the strength of different parts of a bridge to ensure it can hold up under various conditions.
Just as important is validating these assumptions. If the assumptions are wrong, the conclusions you draw could be off the mark.
Each step is important for handling MNAR data. They ensure the accuracy and reliability of your analysis. This careful approach helps prevent skewed results. It also supports better conclusions through the use of statistical analysis with missing data.
Handling Missing Data: How dealing with missing data leads to Wrong conclusions

Missing data can occur for several reasons. First, there are data collection errors. This happens when information isn't gathered right. It may be due to human error or faulty equipment.
It's important to double-check. All systems must be working well before collecting data.
Next, there are mistakes during data processing. This can happen if someone inputs data wrong. Or, if they mishandle the data early in analysis. Ensuring accuracy at this point is very important for reliable results.
Finally, intentional omissions are when people choose not to share certain pieces of information. This decision can greatly affect data analysis. It may skew the results or lead to incomplete conclusions.
Each issue can hurt the data's quality and usefulness. So, we must fix them to ensure accurate analysis.
Example
For example, suppose you see the following graph with the headline: “Major Heat Wave in Atlanta!"
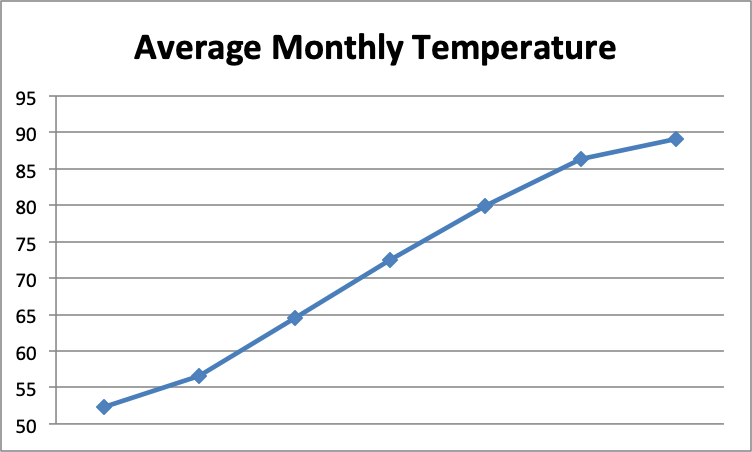
Your initial reaction might be that temperatures are rising precipitously in Atlanta and something must be done to reverse this dangerous trend. What's missing from this graph? The months along the horizontal axis: January through July. Of course monthly temperatures are going to rise dramatically over the spring and summer months!
I once worked for an organization that was trying to figure out why more men than women were participating in their medication trials, a scenario that required analyzing data based on gender participation and the percentage of missing data. A report from the company's labs showed that 60 percent of its study participants were men compared to only 40 percent who were women. The data science team was assigned the job of finding out why men are more likely to participate in the company's medication studies than women.
When team members received this report, they asked, “What significant information are we missing?” “What does it mean that men are more likely than women to participate?” Does that mean that more men applied or that equal numbers of men and women applied but that a greater number of men were accepted? Or does it mean that equal numbers of men and women applied and were accepted but more men actually participated?
This additional data would shift the team's exploration in different directions. If more men applied, the next question would be "Why are men more likely than women to apply for our medication studies?" If equal numbers of men and women applied but more men were accepted, the next question would be "Why are more men being accepted?" or "Why are more women being rejected?" If equal numbers of men and women applied and were accepted but more men actually participated, the next question would be "Why are men more likely to follow through?" As you can see, the missing data has a significant impact on where the team directs its future exploration.
When you encounter a scenario like this, consider both what data might be missing and why it might be missing:
- Why is certain data missing? Data may be omitted intentionally or unintentionally. For example, maybe these numbers reflect only one or two lab studies and that if more data were provided, the percentages would even out. Maybe the studies had space or time limitations that would have impacted the number of women who were willing to participate. Maybe the person providing the data had ulterior motives for withholding certain data.
- What does the claim based on this data actually mean in terms of data analysis?? When a number is preceded or followed by a comparative adjective and nothing more, it could be a signal that something is missing. For example, if you see a phrase such as "60 percent faster," "lighter by over 30 percent," and "20 percent more," you should naturally ask "Than what?" If someone lost 60 percent more weight when taking a certain supplement, does that mean the person lost 60 percent more weight than others who didn't take the supplement or 60 percent more weight than when he or she was not taking the supplement? What does 60 percent more weight equate to? It could be the difference between 1 pound and 1.6 pounds over six months, which would be rather insignificant.
- Why does it matter? Take the negative view. For example, why does it matter that more men than women participate in these medication studies? It significantly affects the study's outcomes, particularly when data might be missing due to non-participation. Would it be beneficial for the company to have more women participate in its studies?
This last question turned out to be significant. The benefit to having more women participate in the company's studies is that young women are more likely to be on prescription medication, which would make the studies more comprehensive. The medication studies would be able to test for a greater number of drug interactions. The flip side is that many women couldn't participate because they were taking a prescription medication that prohibited them from participating in the study. The statistic could then be rephrased as "60 percent of those who are allowed to participate in our medication studies are men.” This tells an entirely different story.
Data Collection Errors
Data collection errors are a frequent reason for missing data in research. It's important to use data validation methods just from the start. This ensures the data meets standards. It helps avoid errors that could create incomplete data.
Implementing error prevention strategies is just as important. These strategies create checks and balances. They find and fix errors in data collection. Focusing on these areas can greatly reduce the chances of missing or wrong data.
Data Processing Mistakes
Mistakes in collecting data are just one side of the coin. But, mistakes in processing data are equally important. These mistakes can mess up your data's accuracy. They can lead to misleading analysis results. This is especially true when missing data may not be well addressed. Here are some common pitfalls to avoid:
- Incorrect Data Entry. Sometimes, typos create missing or wrong data.
- Software Errors. Sometimes the tools we use to process data have bugs or glitches that can mess up the data.
- Improper Data Imputation Techniques. When we use the wrong methods to fill in missing data, it can make our data biased.
- Wrong Statistical Modeling Strategies. Using the wrong statistical models can make problems with missing data even worse.
Fix these errors carefully. It's key to ensure your data analysis is reliable. Each step in handling data needs attention to detail. This will keep your findings accurate and high quality.
Intentional Omissions
Sometimes intentional omissions happen. This is when people don't want to share specific details, prompting the need for a complete dataset for accurate classification.
This really affects all the information we gather. You must grasp that missing pieces can mess up your research. They might even lead to twisted data, underlining the need for a reliable method for missing data. When you set up surveys or research, you should think about ways to lower the chance of missing data, employing various methods to fill in or estimate missing values.
Here's a quick breakdown of why people might leave out info:
Reason
- Hesitation to Share
- Worries About Privacy, which may lead to systematic deleting data.
- Fear of Manipulation
How It Affects Your Study, especially when classification errors are minimized through systematic data handling.
- Leads to skewed results and biased conclusions
- Results in not enough sensitive data being reported
- Makes people distrust the data gathering process
These intentional skips are a big deal ethically. Being clear and earning trust can cut down on the chances of data being intentionally left out. This helps keep your research accurate and dependable, by systematically addressing observed values discrepancies.
Every survey or study you design should include steps to tackle these issues. That way, you can trust the results more and really understand what they mean.
Impact of Missing Data on Statistical Analysis

When dealing with missing data in your dataset, it's important to understand how it reduces the number of usable responses.
These responses are known as your sample size. A smaller sample size weakens your study. It is less able to detect true effects or statistical power. This often leads to biased outcomes, particularly when not all observed variables are accounted for. The conclusions drawn might not truly reflect what's happening. If the data isn't representative, the conclusions might not apply well to other situations or groups. This affects the trustworthiness of your research. It's really important to tackle the issue of missing data head-on when you're conducting your study.
Reduced Sample Size and Statistical Power
Missing data in your study can lead to a smaller group of data, or a reduced sample size. This weakens your study's results. It affects how reliable your conclusions might be. Let's break it down:
- Risk of Missing True Effects. When your study lacks power, you're more likely to miss a real effect. This situation can lead you to conclude that something isn't there. This mistake is known as a false negative.
- Uncertainty in Findings. With less power, the certainty in what your study finds decreases. This means you can be less sure about the results you get.
- Questionable Effect Sizes. If you do find an effect with a small sample, there's a risk it might look stronger than it really is. This can mislead anyone relying on your results.
- Limited Reach of Conclusions. It's hard to say that your findings would apply to a larger group, especially when the missing data's value is not statistically accounted for in the analysis. This is true if your study only covers a small number of people. This makes your results less useful on a broader context.
Biased Estimates and Misleading Results
When we look at what happens when we lack data in a study, it's clear that this can make our findings less reliable. But there's another issue to consider. Missing data can skew our results, leading us to wrong conclusions.
This problem often happens when missing data is caused by the data itself. This happens in cases where data is Missing at Random (MAR) or Missing Not at Random (MNAR).
For example, imagine you're studying test scores, but higher scores are often not reported. If you only analyze the available data, your average might end up being too low. This error can make you think there's a different trend. It can make you see a different relationship between factors than what's really there.
So, it's key to understand and fix missing data. It helps us ensure that our analysis is accurate. It makes our conclusions trustworthy. We need to be careful not to let gaps in our data mislead us. They could make us believe something false.
Compromised Validity and Generalizability
Incomplete data hurts your study's trust and relevance. Missing key info makes it hard to be sure that your results are accurate. They show what you're trying to find or predict. This issue can impact both the scientific value and practical use of your study. Here are a few key points to keep in mind:
- Skewed Analysis. When data is missing, the analysis may become biased. This can lead to misleading conclusions about what's really happening.
- Weaker Results. Incomplete data may harm your statistical tests. This will make your study's findings less dependable.
- Narrower Conclusions. If your study misses out on including diverse groups, it's hard to say if your findings apply widely. They might just apply to specific groups.
- Flawed Decisions. Decisions or policies based on incomplete data may not work as planned. This can lead to unhelpful or harmful results.
Best Practices for Handling Missing Data
When handling missing data, start thinking about ways to prevent it early. Do this while you're still planning your research and gathering your data, to minimize bias and improve the probability of accurate results. You need to spot and understand why data is missing in different situations. Then, you can pick the right methods to fill in those gaps well. Missing data is a common issue.
Choosing how to fill in missing data isn't just about plugging holes. It's about keeping your findings accurate and reliable. That's why it's helpful to use sensitivity analysis. This method checks if your conclusions still hold up even when some data pieces are missing.
Prevention Strategies in Study Design and Data Collection
To address missing data, set up your study and collect data precisely. Here are some essential actions to consider:
- Implement Strong Data Validation. Make sure the tools used for entering data have built-in rules that stop any nonsensical or incorrect entries, and can efficiently replace missing values.
- Refine Your Study Protocol. It's important to have clear guidelines. Make sure all data gatherers are well-trained. They must understand these guidelines well.
- Design User-Friendly Data Collection Tools. Create forms and surveys that are easy to understand and use, especially in fields like medical research and political science, to ensure data is complete and representative. This helps prevent mistakes by the people involved in the data collection process.
- Plan for Contingencies. Be aware that some data might still be missing, despite your best efforts. Adjust the number of participants. Set realistic goals for your data's completion.
Identification and Assessment of Missing Data Patterns
Start by using a stats program to find and measure how much data is missing. It's important to know this at the beginning because it affects how reliable your analysis will be.
Then, look at the missing data patterns. See if they fall into one of three categories: Missing Completely at Random (MCAR), Missing at Random (MAR), or Missing Not at Random (MNAR).
Knowing the type of missingness helps you choose the best way to fill the gaps. Always keep in mind: how thorough your first analysis is greatly affects your final results' accuracy.
Appropriate Imputation Methods for Different Scenarios
After spotting the missing data patterns in your research, you must pick the right imputation methods. This is essential to keep your analysis accurate. Let's get into some tailored strategies:
- Mean/Median Imputation. This method is great for situations where the missing data (MCAR) isn't related to other variables. It simply fills in missing values with the average or median, making it a straightforward fix, although not always the best for every statistical analysis with missing data.
- Multiple Imputation. If data is missing at random (MAR), this technique is ideal. It addresses the uncertainty of missing values. It does this by creating several versions of your dataset, a key method for missing data that helps reduce bias. This allows for a more robust analysis.
- Regression Imputation. When dealing with continuous variables, this method is very useful. It uses trends in existing data to estimate missing values. The imputations are sensible given your data's context, especially when considering the complete dataset.
- Logistic Regression. For categorical data, logistic regression helps match the imputed values. It matches them with the natural distribution of your observed data. This alignment is key. It keeps the integrity of category variables.
Each of these techniques has its place. It depends on the nature of your missing data and the type of variables, suggesting a need for an unbiased methodology.
Sensitivity Analysis to Test Robustness of Conclusions
When dealing with missing data in your research, It's vital to do sensitivity analyses.. This process helps you check if your conclusions still hold up. It does this when you make different assumptions about why data is missing.
Sensitivity analysis means you slightly change how you handle missing data. Then, you watch to see if your results change. It's an important step to ensure your findings are reliable.
Here's a quick breakdown of how different assumptions might affect your results:
- MCAR (Missing Completely at Random). Your conclusions will likely stay the same, showing minimal impact.
- MAR (Missing at Random). You might see some changes, but they'll generally be moderate.
- MNAR (Missing Not at Random). Expect big changes. They show a strong sensitivity to how we handle missing data.
Conclusion - Prevent Missing Data
When we make decisions based on data, missing information can lead us to incorrect conclusions.
Think of it like missing pieces in a puzzle; without them, the picture isn't clear.
To avoid this, use strong techniques for managing missing data. Be clear about how your data is handled in your reports.
By using the right methods, we ensure our findings are not just guesses. It's about being thorough and precise. This way, every decision we make is based on solid info. It's info we can depend on, provided that any missing data is systematically and statistically accounted for.
Data science teams need to stay alert, particularly to the percentage of missing data and its impact on longitudinal studies. They need to watch for missing data. If a claim seems too good or too bad to be true, the team needs to question it and ask, "What's the rest of the story? What's missing? What's been omitted, intentionally or not?" The team also should always be asking, "Do we have all the relevant data?"
Frequently Asked Questions
What are the implications of not addressing missing data in a data set?
When you don't handle missing data in your data set, these may happen:
1. Biased Results Due to Incomplete Statistical Analysis With Missing Data. If some data is missing, your results might lean in one direction more than they should. This means they're not giving you the full picture.
2. Less Statistical Power. Without all the data, your analysis won't be as strong. It's like trying to understand a story when you've missed parts of it.
3. Wrong Conclusions. Lacking data can lead you to make wrong conclusions. Imagine deciding based on only half the facts.
In short, always make sure you deal with missing data. If you don't, you might not get a true understanding of what your data is trying to tell you.
What does it mean when data are missing completely at random (MCAR)?
Imagine you're collecting puzzle pieces. But, some are missing. When data are MCAR, the missing pieces are lost without any pattern. Here's what you need to know:
- The chance of each piece missing is the same, no matter which piece it is.
- Missing pieces don't depend on the pieces you already have or the ones you don't.
- This situation is the easiest to fix because it doesn't mess up your puzzle solving.
- You treat each missing piece the same way to solve the puzzle fairly.
- With the right approach, you can still see the whole picture without guessing.
When you handle it right, you can still complete your puzzle well. You can do it without any bias or unfairness.
How do missing at random (MAR) and missing not at random (MNAR) differ?
When we talk about missing data, there are two main types. They are: Missing at random (MAR) and missing not at random (MNAR).
MAR means the chances of missing data are linked to the data we can see. It's not linked to the missing data itself.
Missing data are MNAR when the reason for missing data affects whether it's missing or not.
Dealing with MAR is a bit easier because we can use specific statistical methods to work around it. However, MNAR is trickier because it involves understanding why the data is missing in the first place.
In short, MAR lets us handle missing data easily. MNAR adds extra challenges. We must know why the data is missing to handle it.
What are some common methods for handling missing data?
Dealing with missing data can be a bit tricky, but there are some common methods that can help out. One approach is complete case analysis, where we focus only on cases with all the data present. However, this method might make us miss out on important information and reduce the sample size, so it's not always the best choice.
Another way to handle missing data is by using imputation techniques. These techniques involve filling in the missing values with estimated ones based on the data we do have. For example, we could use the mean value, do a regression analysis, or use multiple imputation to fill in the gaps.
Lastly, there's sensitivity analysis, which is like testing the waters with different ways of handling missing data to see how it might affect our results. It gives us a good idea of how robust our findings are under different scenarios.
So, these are just some friendly ways to tackle missing data in our analysis.
Can imputation methods introduce bias into the analysis with missing data?
When we handle missing data, choosing the right way to fill in those gaps is key. If we don't choose wisely, we might skew the results. This skewing is like adding too much salt to a soup; it changes the original flavor.
Here are some steps to avoid such issues:
- Understand the type of missing data.
- Pick a filling method that suits the data type.
- Use simple methods first.
- Check if the chosen method changes the results too much.
How does the amount of missing data in a data set affect the analysis?
Missing data amounts can greatly affect the analysis. They reduce the sample size and statistical power.
More missing data means a higher chance of bias. It also makes it harder to draw reliable conclusions.
The impact also varies depending on how the data are missing (MCAR, MAR, MNAR) and the methods used to handle the missing observations.
You must assess the pattern and amount of missing data. This is critical in analysis.
Why is it important to understand the pattern of missing data in a data sample?
When we look at data that is missing from a sample, it's important to understand the pattern of this missing data. This helps us choose the best ways to handle it.
Different patterns, like random or systematic, tell us why the data is missing. This affects which statistical methods we use and how we understand the results.
Finding these patterns can also show us problems in how we collect the data, highlighting the importance of complete data to reduce bias. This gives us a chance to make things better.
To make this clearer, think of it as "putting the pieces of the puzzle together." Here are some simple steps, including a methodology for handling missing data.
- Look closely at the data.
- Notice which data is missing.
- Think about why the data might be missing.
- Choose the right methods for handling of missing data.
- Use what you learn to improve data collection in the future.
What role does a data analyst play in dealing with missing data?
A data analyst is like a detective. They look for missing pieces in data:
- They find how much data is missing.
- They choose ways to fix the missing data, often using imputed data or other various methods.
- They check how missing data affects results.
Data analysts use simple math methods to handle missing data. This makes sure their findings are correct and trustworthy. They also give advice on how to collect data better, aiming to achieve complete data. This helps reduce missing data in the future.
How do missing data affect categorical data differently from continuous data?
When data is missing, it can change how we handle and understand different types of data, like categorical and continuous data. Here's how we fix missing data for each type:
- For categorical data, we often pick the most common category or guess using a model.
- For continuous data, we might use the mean or median value, or even more detailed methods.
- Choosing the right method depends on what we need to learn from the data and how the data is missing.
- Each method affects the data's accuracy and consistency in different ways.
- It's important to choose wisely to get the best results from our data analysis.
Using simple methods like these helps ensure our data is complete. It is also useful for making decisions or gaining insights.

This is my weekly newsletter that I call The Deep End because I want to go deeper than results you’ll see from searches or AI. Each week I’ll go deep to explain a topic that’s relevant to people who work with technology. I’ll be posting about artificial intelligence, data science, and data ethics.
This newsletter is 100% human written 💪 (* aside from a quick run through grammar and spell check).
More Sources:
- https://journalofbigdata.springeropen.com/articles/10.1186/s40537-021-00516-9
- https://www.bauer.uh.edu/jhess/documents/2.pdf
- https://towardsdatascience.com/7-ways-to-handle-missing-values-in-machine-learning-1a6326adf79e
- https://www.datacamp.com/tutorial/techniques-to-handle-missing-data-values
- https://www.pecan.ai/blog/common-data-analysis-mistakes/
- https://www.ncbi.nlm.nih.gov/pmc/articles/PMC6329020/
- https://ydata.ai/resources/what-is-missing-data-in-machine-learning
- https://www.researchgate.net/publication/237061322_The_prevention_and_handling_of_the_missing_data
- https://www.sciencedirect.com/science/article/pii/S1073874624000082